
Dollar Retreats From Channel Top, but Rate Expectations Keep a Lid on the Slide
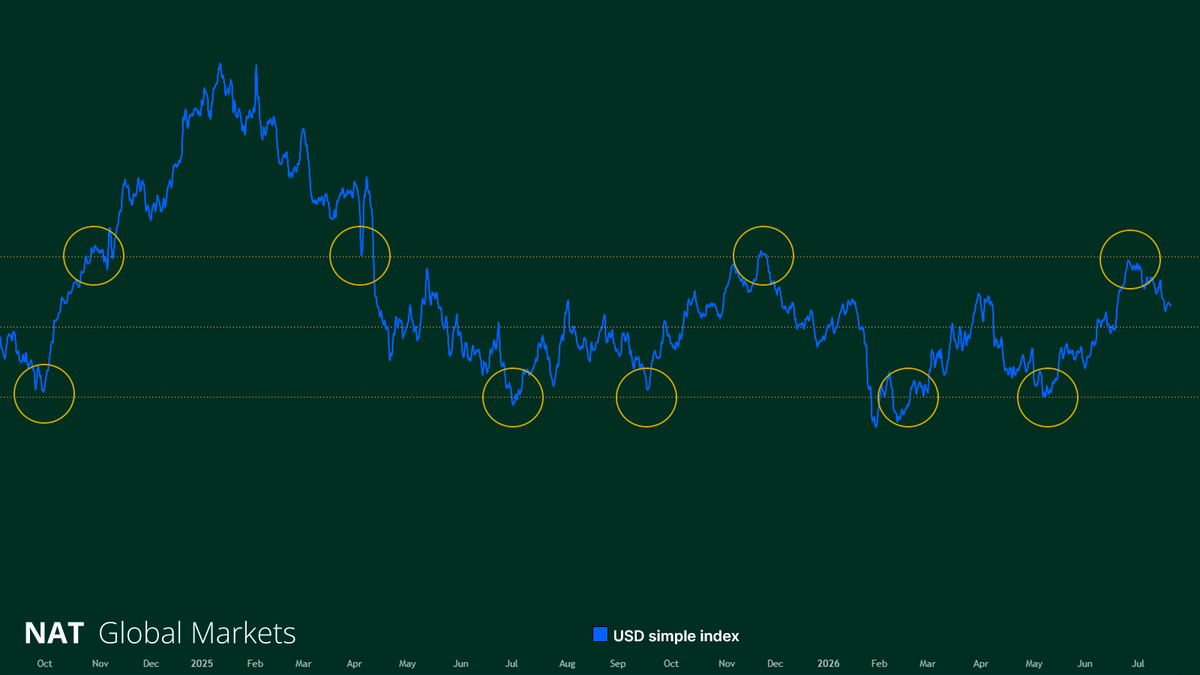
The U.S. dollar index has pulled back after touching the upper edge of a trading range that has held since 2025, tipping into a local downtrend. Technically, the index now has more room to fall than to rise—but the underlying fundamentals aren't yet strong enough to let that trend run.
What Sparked the Pullback
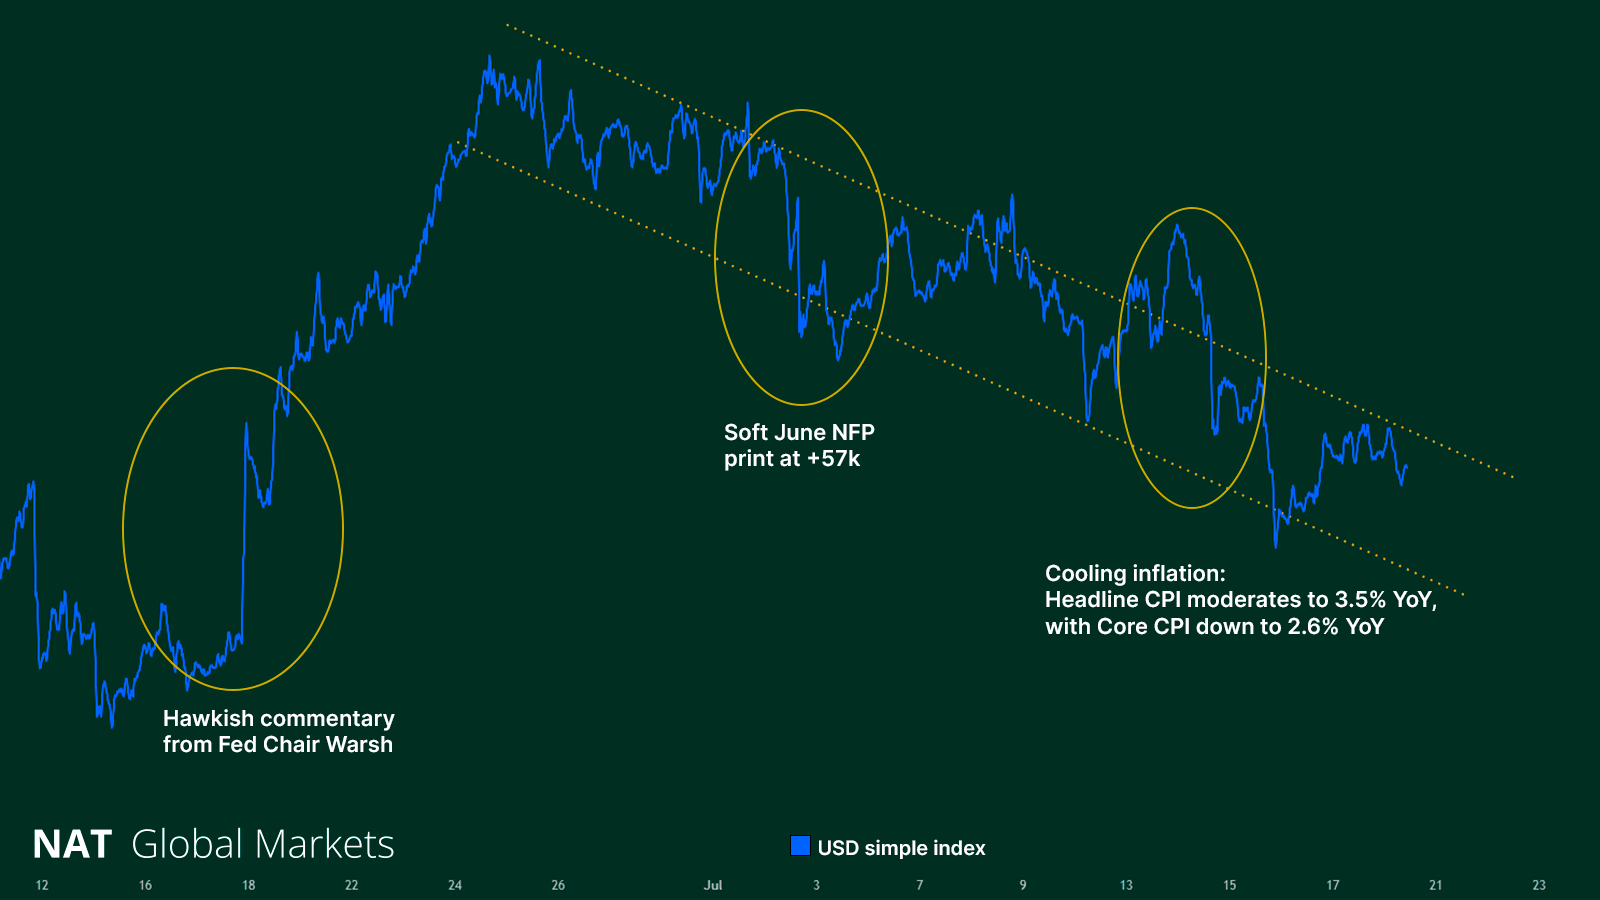
The dollar's recent softness reflects a pendulum swing. It first rallied sharply on hawkish remarks from new Federal Reserve Chair Kevin Warsh, who reaffirmed the Fed's unwavering commitment to its inflation target and its readiness to respond swiftly to any reacceleration. That rally then reversed as softer economic data came in.
The key trigger was a sharp deterioration in labor-market data (nonfarm payrolls), which set off the dollar's current local weakness. An external factor added to the pressure: de-escalation in the Strait of Hormuz and the subsequent drop in oil prices, which pulled down U.S. gasoline costs. That, in turn, showed up in June's inflation data, with headline CPI cooling to 3.5% year-over-year from 4.2%, extending the dollar's downtrend.
One important nuance: the disinflation wasn't just an energy story. Components such as Shelter and Transportation also slowed, suggesting the fuel-driven price spike of April and May hadn't fully worked its way through the broader economy.
Why the Dollar Isn't Falling Further
Despite all this, the index's decline has so far been contained, for two reasons.
First, rate expectations haven't shifted as dramatically as the headlines might suggest. The inflation data created a local "peak" in dovish sentiment rather than a lasting reversal:
| Period | Hold at 3.50%–3.75% | 25bp Hike to 3.75%–4.00% | Main Driver |
|---|---|---|---|
| Before July 14 (early month) | ~65%–75% | ~25%–35% | Hawkish Fed rhetoric, concerns over persistent inflation pressure |
| After July 14 (right after CPI) | ~83%–85% | ~15%–17% | June inflation data came in below forecasts |
| As of now (July 21–22) | ~73.4%–83.4% | ~16.6%–26.6% | Position adjustments ahead of the pre-FOMC blackout week |
Soft inflation data did strengthen bets on a pause, but the shift so far isn't decisive enough to meaningfully reverse the dollar's broader trajectory.
Second, markets have largely gone quiet ahead of the Fed's July 28–29 meeting. A hold is already almost fully priced in—attention has shifted instead to what the accompanying commentary will signal.
Three Scenarios for the Meeting
| Scenario | Market Probability | Asset Reaction (USD, Bonds, Equities, Crypto) |
|---|---|---|
| 1. "Hawkish Hold" (base case) | ~75% | Stability. The Fed holds at 3.50%–3.75% but warns that a hike is coming if inflation settles back above 3%. Two-year yields stay in the 4.0%–4.2% range. |
| 2. "Dovish Hold" | ~15% | Risk-on rally, dollar weakens. The Fed signals current rates are already sufficiently restrictive and the disinflationary trend is intact. Bond yields fall, equities rally. |
| 3. Surprise 25bp Hike | ~10% | Shock and sell-off. Rates rise to 3.75%–4.00%. Sharp jump in two-year Treasury yields and the dollar index (DXY), with equities selling off. |
What Longer-Dated Futures Are Pricing In
September and December futures suggest traders aren't yet convinced the tightening cycle is over:
- September 2026: futures price roughly a 50%–54% probability of a hike to 3.75%–4.00%.
- Year-end 2026: futures markets are pricing in at least one 25bp hike by year-end, underpinned by a persistently tight labor market and continued economic tailwinds from investment—including the AI sector—and fiscal stimulus.
As long as markets keep betting the tightening cycle isn't finished, the dollar will struggle to sustain a decline—even soft economic data is likely to be met with bounces higher rather than a lasting slide.