
CADCHF Pair SFA Indicator Signal
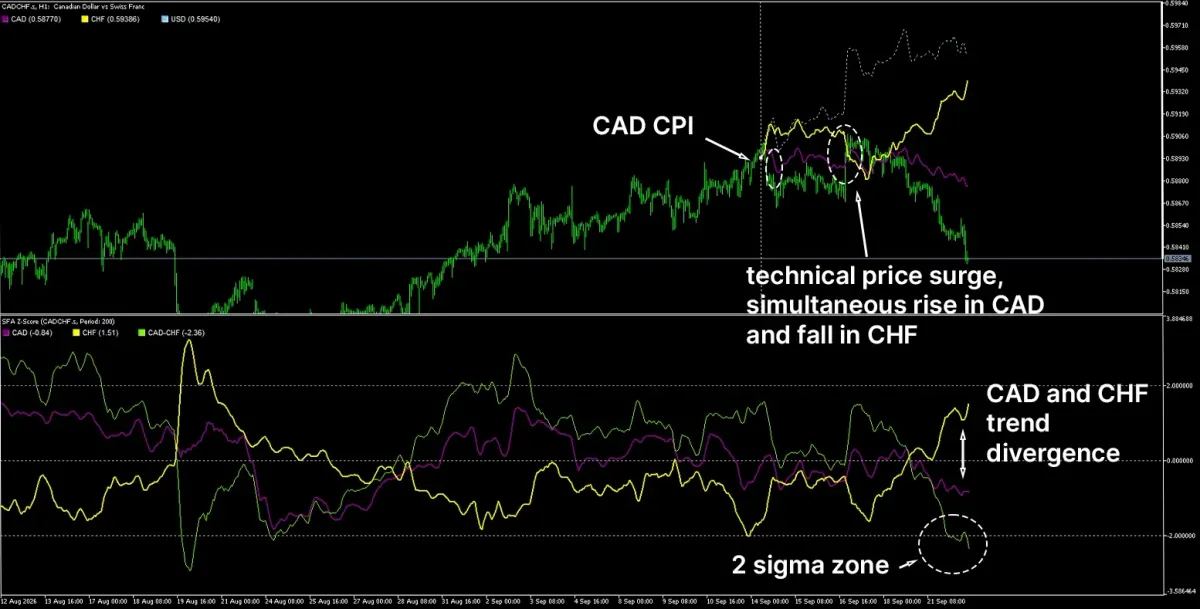
The CADCHF has entered oversold territory on the H1 chart. The pair has been actively declining since September 14 (excluding the technical surge on September 17). The reasons for this decline are the divergence in the trends of the CAD and the CHF. The CAD was trending downward, while the CHF, on the contrary, was actively rising.
Factors driving CAD weakness:
- weak inflation data
- a temporary de-escalation of the conflict in Iran amid the UN General Assembly and a decline in Brent crude oil prices from 110 to 100 over the same period.
Factors driving CHF strength:
- possible hedging of diplomatic risks amid the UN General Assembly
- profit-taking on trades ahead of the SNB meeting on September 24.
It appears that in the current situation, the likelihood of further growth in the pair is higher than the likelihood of a decline. If oil prices rise, this will lead to a stronger CAD and support the pair if the CHF strengthens further. If oil prices fall, this will increase risk appetite, leading to franc weakness and supporting the pair. Therefore, the current market appears to be an interesting entry point for long positions after the SNB meeting.
The risk of a long position on the pair is skewed more toward the SNB (if the SNB takes a tough stance or signals readiness for currency intervention) than toward oil prices and the Canadian economy.